Systematic Multi-Factor
Investing in Small &
Micro-Cap Equities
An 18-factor quantitative ranking system covering small and micro-cap stocks across Europe, the United States, and Canada. Rule-based, fully systematic — no discretion, no narrative.
Europe · United States · Canada
The strategy covers small and micro-cap equities across the North Atlantic primary listings. This segment is structurally under-researched by institutional investors — analyst coverage is thin, pricing inefficiencies are larger, and factor premiums tend to be more persistent than in large-cap markets.
With 24 equally-weighted positions and weekly rebalancing, the portfolio maintains broad diversification across geographies and sectors while rotating continuously toward the highest-ranked stocks.
How Stocks Are Scored
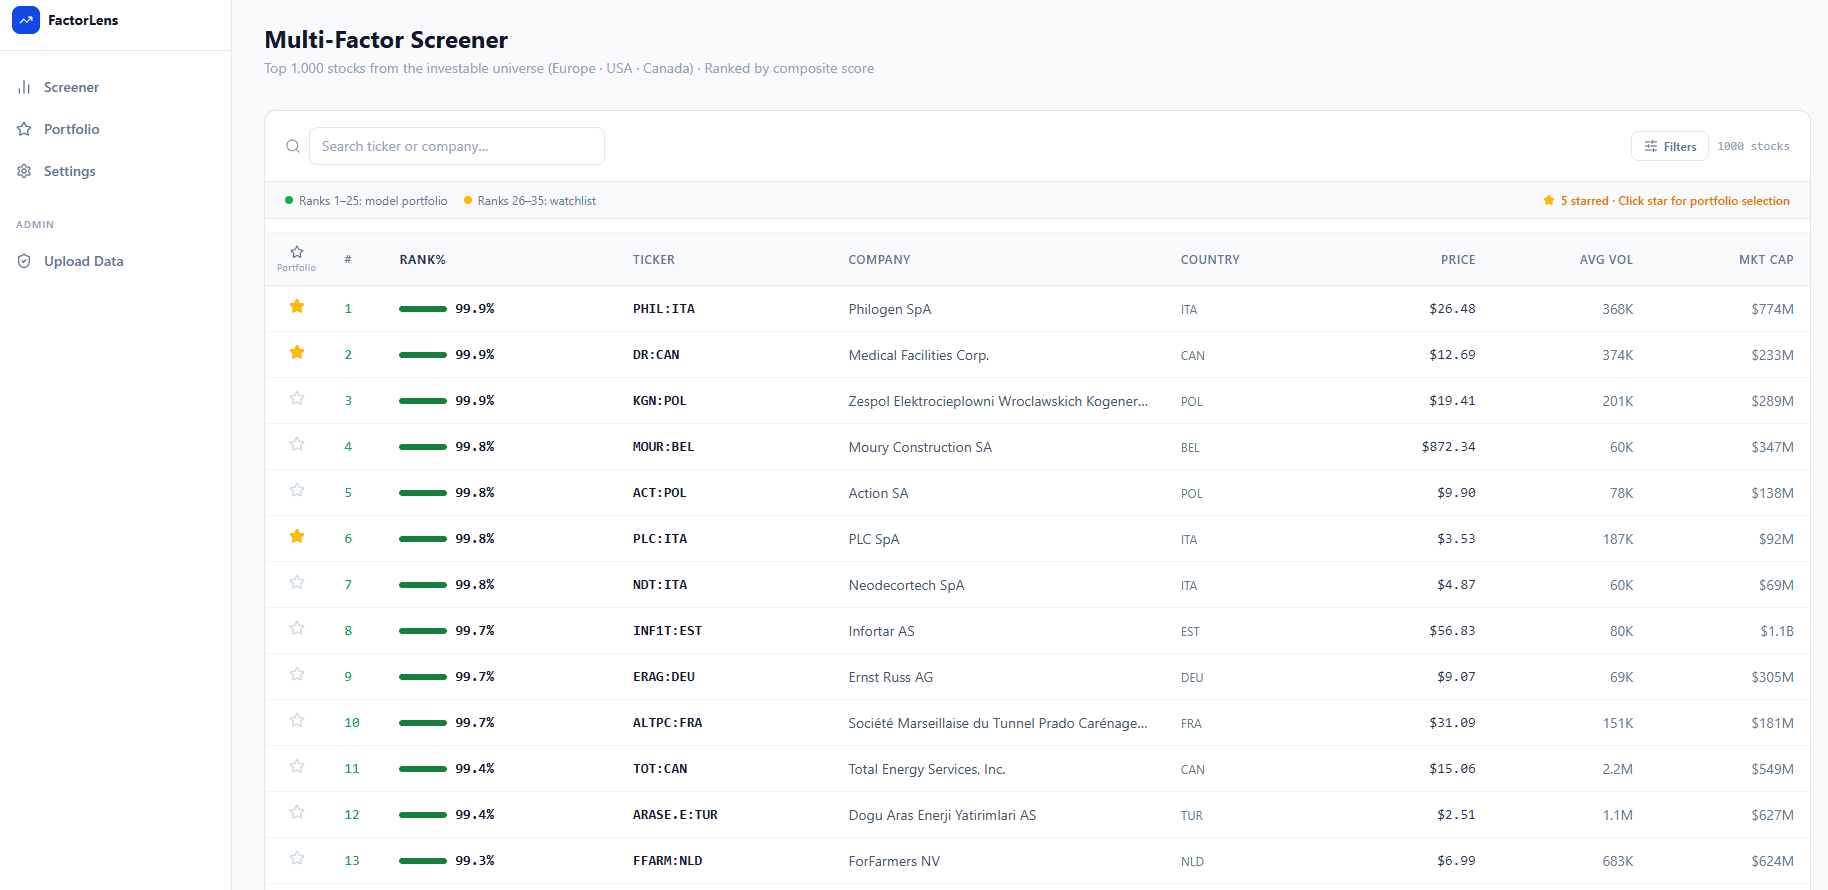
Every stock in the universe is evaluated simultaneously across all 18 factors. The ranking system produces a composite score from 0 to 100% for each stock — reflecting where it stands relative to the entire universe. A score of 100% means the stock ranks highest across the combined factor model.
Universe Scan
All small and micro-cap primary listings across Europe, the US, and Canada are evaluated each week.
18-Factor Composite
Each stock receives a composite rank based on 18 equally-weighted factors spanning momentum, quality, value, and risk.
Top stocks → Portfolio
The highest-ranked stocks enter the portfolio. When a held stock slips out of the top tier, it is replaced by the next best-ranked stock.
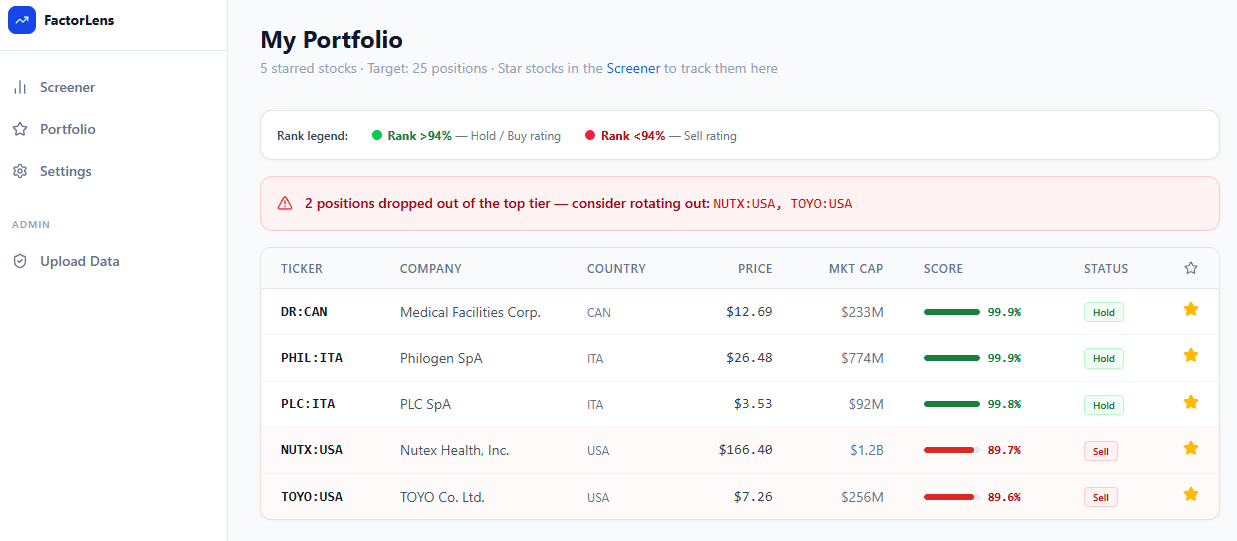
Top-ranked stocks in the universe — the model holds these positions.
Stock has slipped out of the top tier — replaced by the next highest-ranked name.
Why These 18 Factors?
The selection process started with a universe of approximately 300 candidate factors. Each factor was tested individually for alpha generation in the small and micro-cap universe.
A rigorous correlation analysis was then run across the top-performing factors to identify those with the lowest pairwise correlations. Factors that were highly correlated with each other — effectively measuring the same thing — were eliminated, retaining only the one with stronger standalone performance.
The result is a set of 18 factors that are as uncorrelated as possible, each contributing independent information. This diversification across signal types is what gives the composite score its stability across different market regimes.
The 6 Factor Categories
Price trend and relative strength signals across multiple timeframes
ROI, ROA, ROE, and operating income growth metrics
Free cash flow and shareholder return signals
Earnings yield, EV/Sales, and EBITDA/EV metrics
Price deviation and financial stability filters
Piotroski F-Score for comprehensive fundamental quality
Your quant edge — scores updated daily
Stop sifting through noise. CapScreener surfaces the highest-ranked small and micro-cap stocks from a universe of 1,000+, scored across 18 independent factors. Scores are refreshed daily — you only need to act once a week. No guesswork, no opinion.
1,000+ stocks ranked in one view
- Composite score from 0–100% per stock
- Filter by market cap, volume, and price
- Star any stock to add it to your portfolio tracker
Know exactly when to hold and when to rotate
- Live score for every position you hold
- Instant sell alerts when a stock drops below the threshold
- Based on 17-year backtest with 27.29% annualized return
Access the live screener
Weekly scores for the full universe. Portfolio tracker with sell alerts. Transparent methodology. Scores refreshed daily — act once a week.
Past performance is not indicative of future results. This is not investment advice.